
Resources
Benchmarks & Datasets
Benchmarks and datasets developed by the Intelligent Visualization Lab and collaborators, widely used for evaluating chart understanding and reasoning in multimodal AI systems.
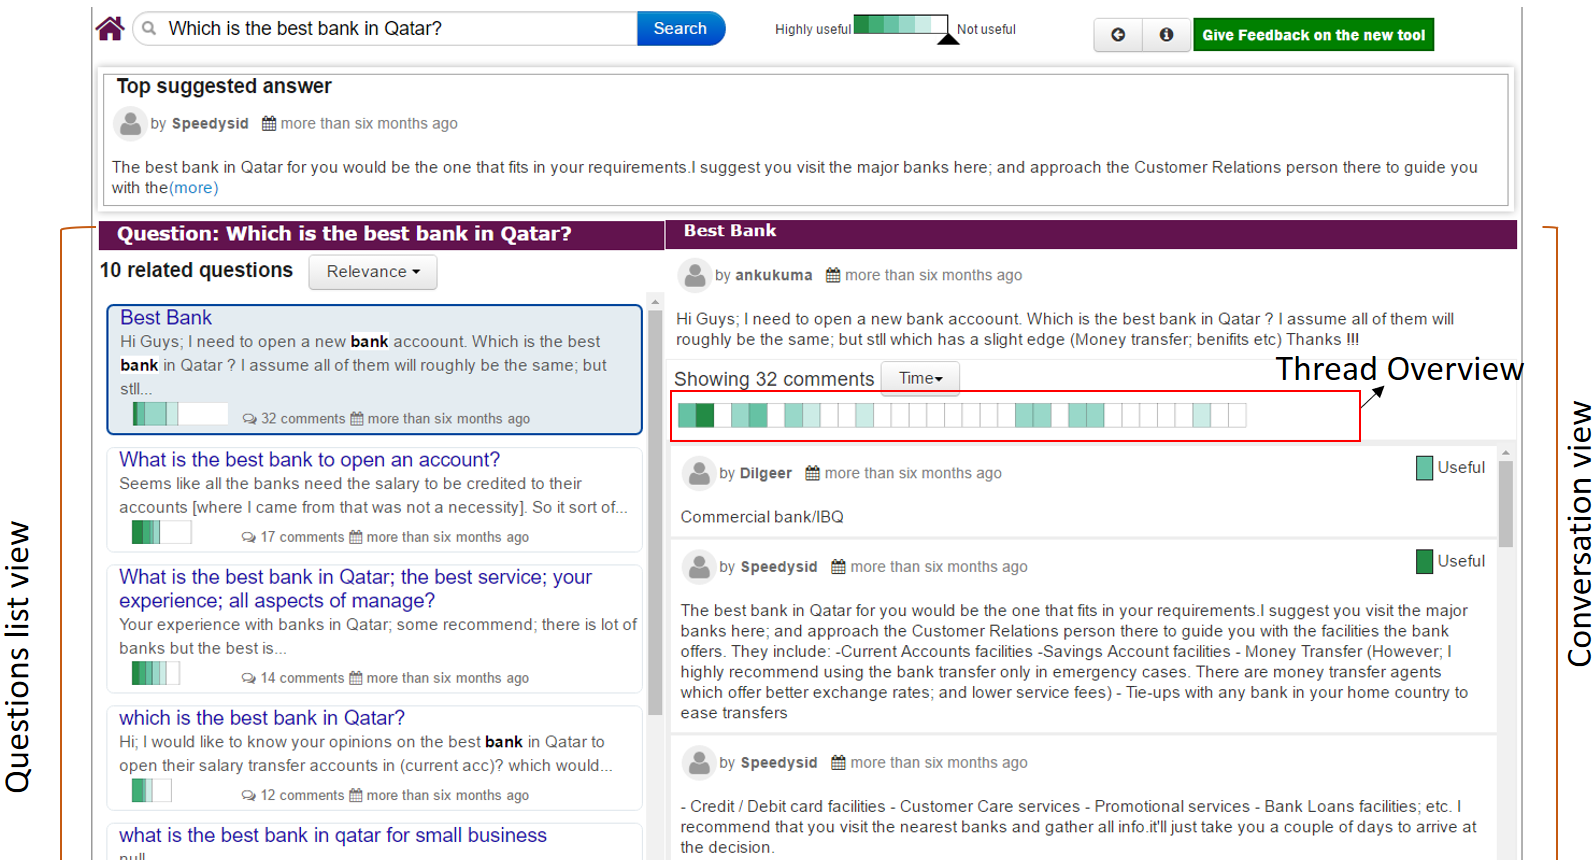
A benchmark for question answering about charts with visual and logical reasoning (ACL 2022). Widely adopted for evaluating chart understanding in multimodal AI systems.
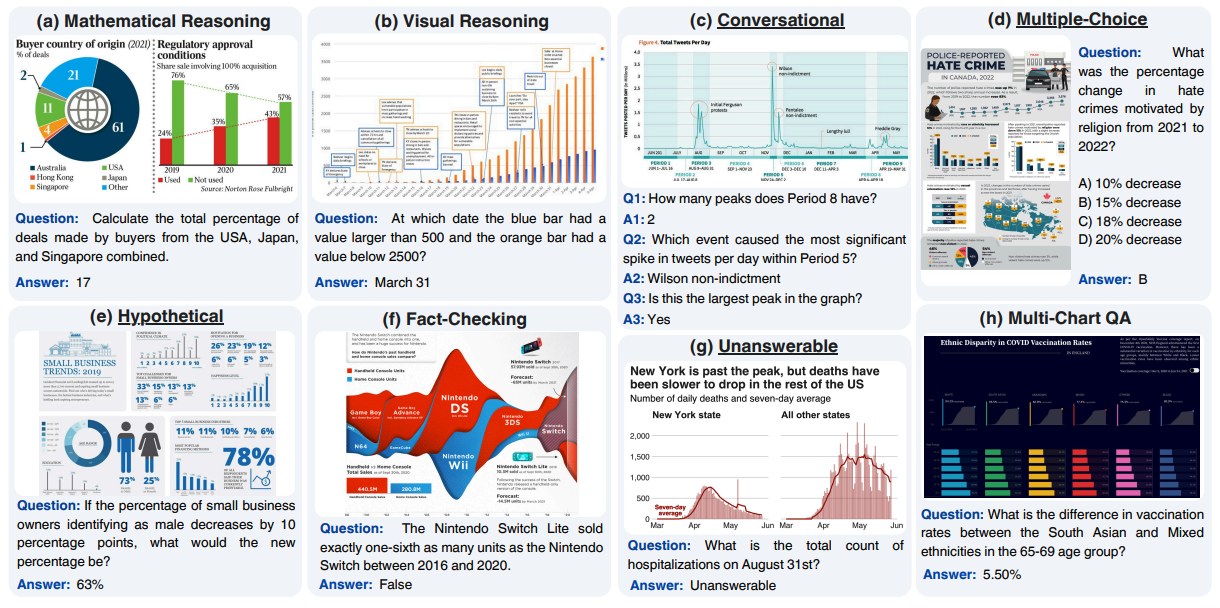
A more diverse and challenging benchmark for chart question answering, spanning 157 sources and varied chart types including infographics and dashboards (ACL 2025).
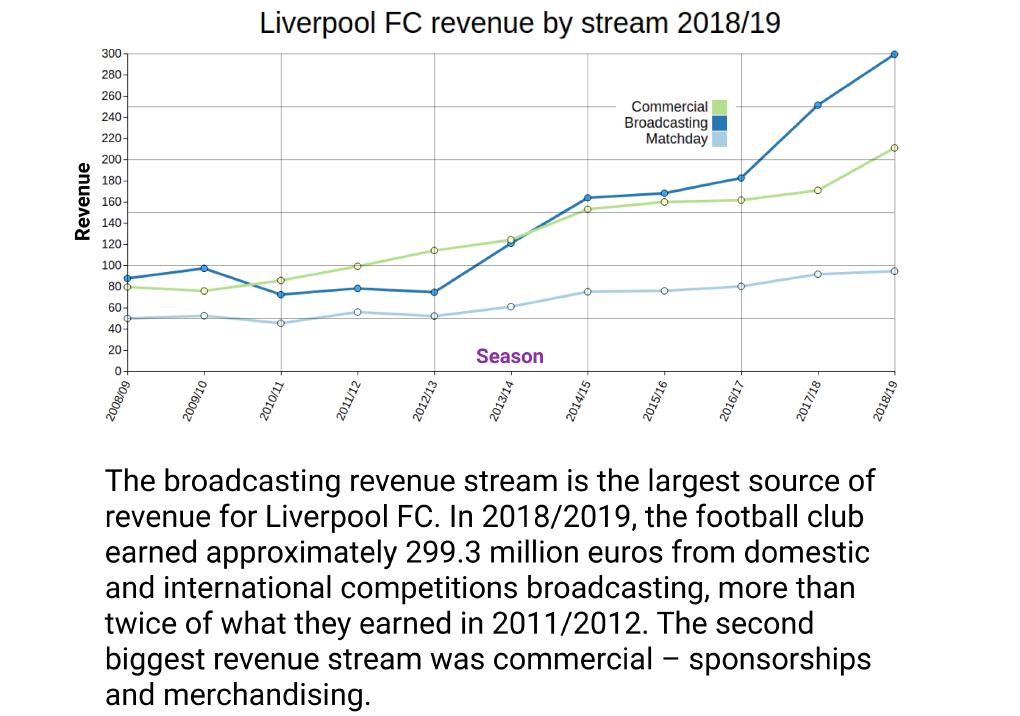
A large-scale benchmark for chart summarization with two datasets covering a broad range of chart types (ACL 2022).
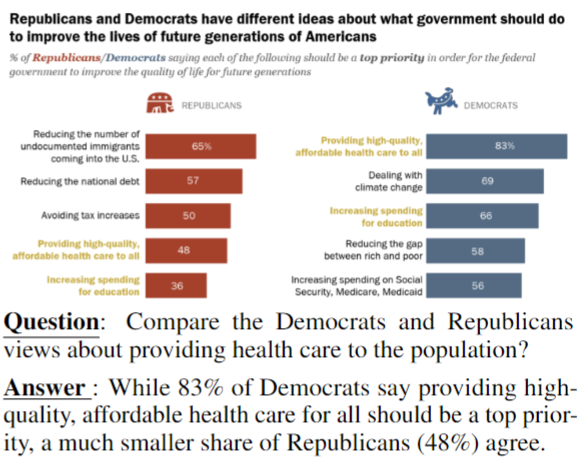
A benchmark for open-ended question answering with charts, where answers are explanatory texts (EMNLP 2022).

A challenging and diverse benchmark for generating multimodal visualizations from natural language (EMNLP 2025).
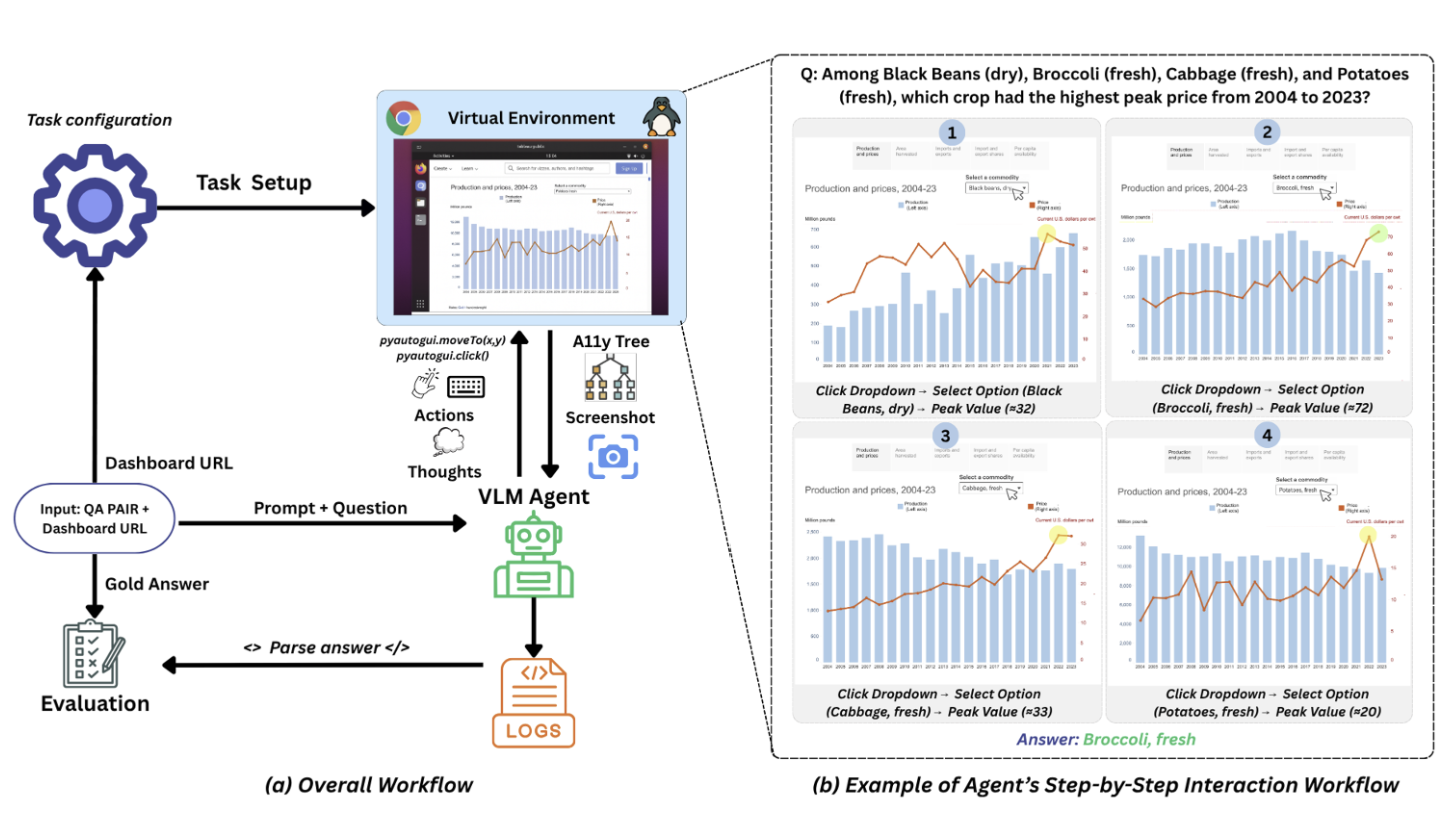
A benchmark for evaluating multimodal agents on question answering over interactive dashboards (EACL 2026).
Models
Open models for chart comprehension, reasoning, and generation.
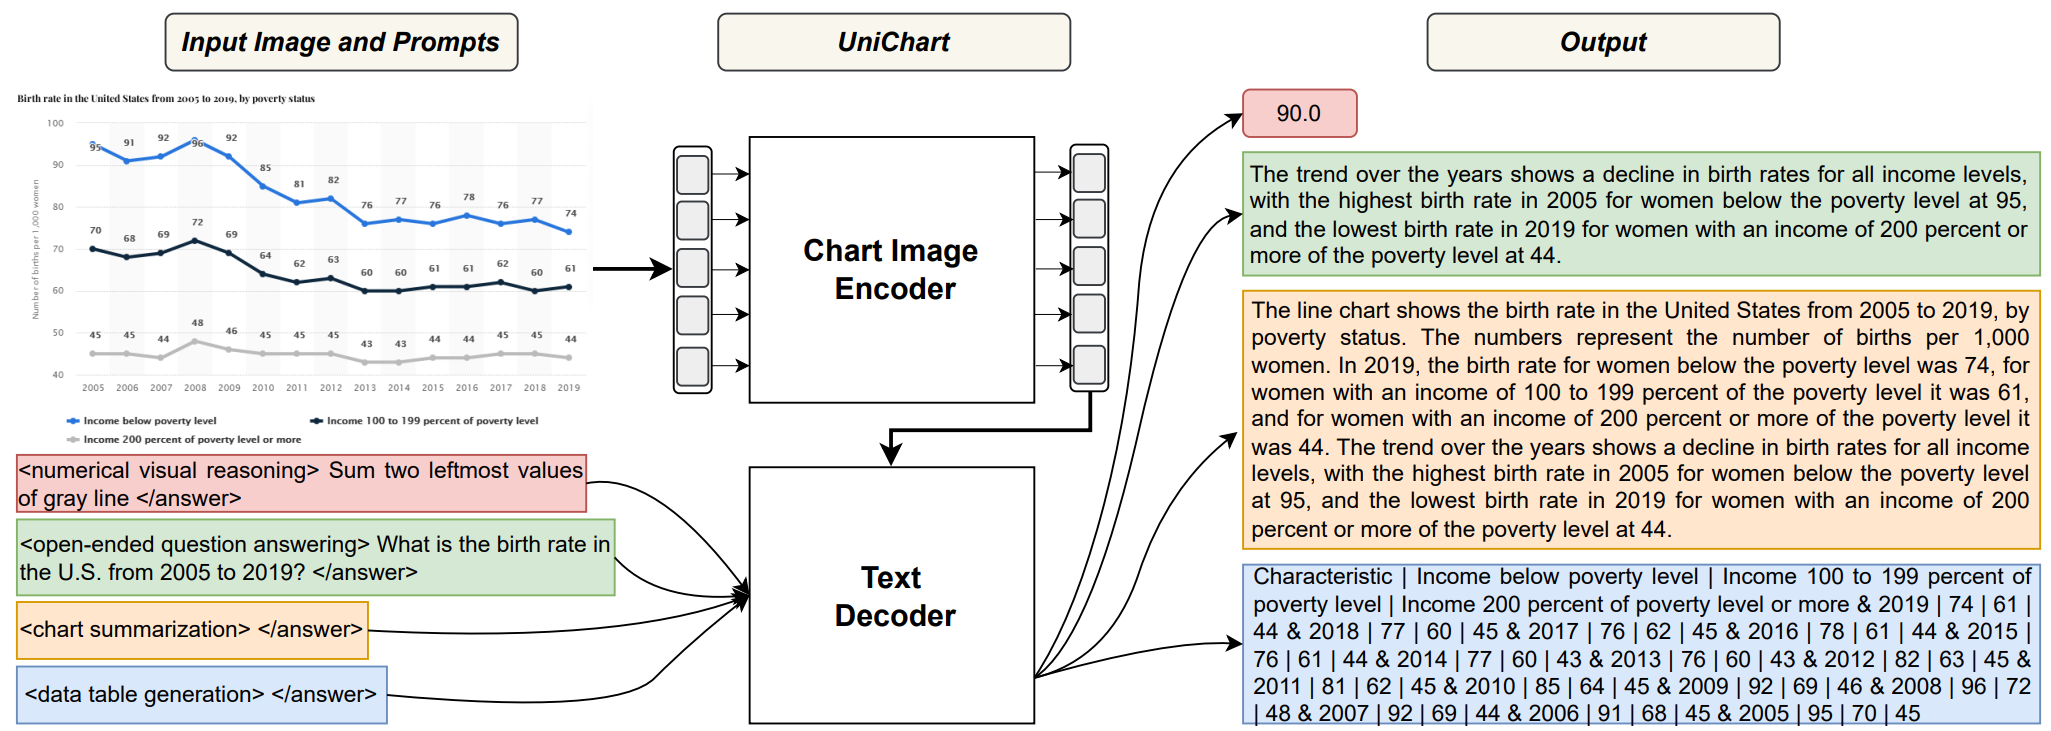
A universal vision-language pretrained model for chart comprehension and reasoning (EMNLP 2023).
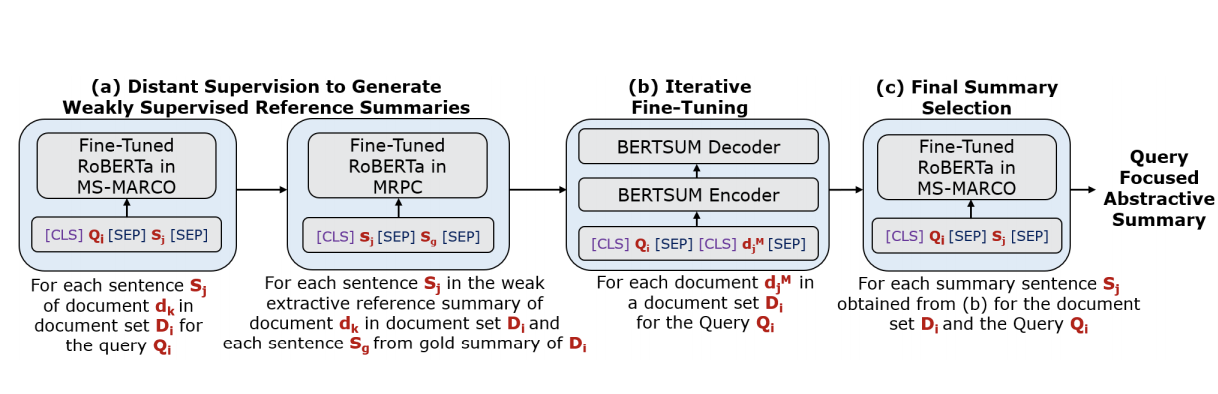
A chart understanding and reasoning model built on PaliGemma, instruction-tuned directly from chart images (COLING 2025).

Instruction tuning for chart comprehension and reasoning, with a dataset of 191K instructions (ACL 2024).